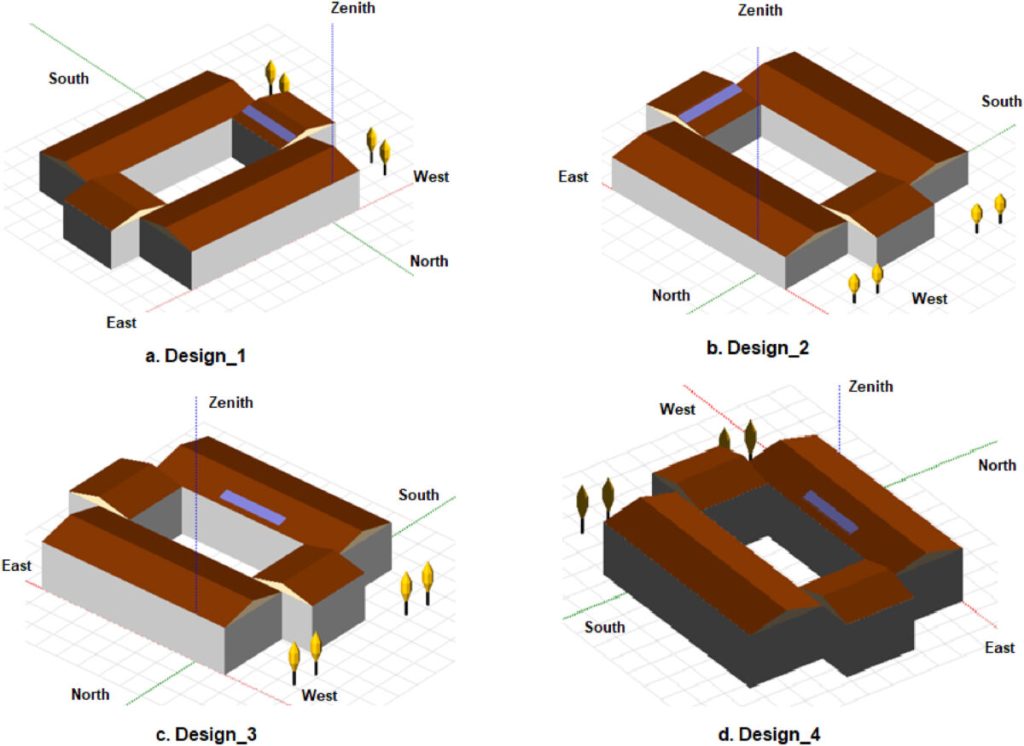
Researchers in Indonesia have investigated how shading effects may influence the performance ratio of a PV system. Their analysis also considered payback period and return on investment.

Image: Polytechnic State of Ujung Pandang, Results in Engineering, Creative Commons License CC BY 4.0
Scientists from Indonesia have investigated the effects of shading on a PV system's performance ratio (PR) by considering different azimuth and solar module tilt angles.
The PR is a parameter that defines the relationship between the actual and theoretical power production of a PV system and is largely unrelated to an installation’s location and orientation. This value is used to understand how efficiently the PV system is operating.
“Previous studies have mostly focused on how shadowing affects a PV system's energy production,” the research said.
Using the PVsyst software, the academics analyzed the shading effects of a rooftop PV system installed on the administration building of the Polytechnic State of Ujung Pandang, which is located in Makassar, the largest city in Eastern Indonesia.
“The PVsyst software was applied to evaluate the shading effect, loss diagram, and PR over the entire year,” the research group said. “The proposed scheme also examines the financial analysis of the proposed PV system, namely, payback period (PBP) and return on investment (ROI).”
The planned system was assumed to have two strings, with nine PV modules in each string. Each panel had a nominal power of 420 W in standard test conditions, for a total of 7.56 kW for the entire system of 18 modules. The researchers also assumed the system would sell surplus power to the grid under a net metering regime.
The analysis considered local global horizontal irradiation, horizontal diffuse irradiation, ambient temperature, global incident irradiation, and effective global irradiation. All of these factors were then used to calculate the actual energy produced by the PV array, energy injected into the grid, and PR.
“In general, there are only two distinct seasons in Indonesia’s climate: dry and rainy, both of which are relative,” said the scientists. “The dry season begins in April and lasts until September, with each of these two seasons lasting for six months. Then, at the end of September until March, the rainy season begins.”
Based on those conditions, four scenarios were tested: Design-1 with a tilt angle of 14 degrees and an azimuth of -90 degrees; Design-2 with a tilt angle of 13 degrees and an azimuth of 90 degrees; Design-3 with a tilt angle of 10 degrees and an azimuth of 0 degrees; and Design-4 with a tilt angle of 15 degrees and an azimuth of 180 degrees.
According to the researchers, Design-3 achieved the best results, with a PR of 0.817, PBP of 7.8 years, and ROI of 155.2%. On the other hand, Design-4 achieved the worst results, with a PR of 0.815, PBP of 8.6 years, and ROI of 131.8%. Design-1 and Design-2 achieved similar results, with both having a PR of 0.816 and PBP of 8.2 years. Design-1 had an ROI of 145.2%, while Design-2 had 144.3%.
“Consequently, it is recommended to utilize the Design-3 to achieve the best PR and investment,” concluded the scientists.
Their findings were presented in the study “Evaluating the shading effect of photovoltaic panels to optimize the performance ratio of a solar power system,” published on Results in Engineering. The research group was formed by academics from Indonesia's Polytechnic State of Ujung Pandang and The University of Gadjah Mada.

